causalStudio™
Engineered to answer research questions that no other analytical software platform can tackle
Easy-to-Use, Modern Causal Inference Methods to Answer Key Business Questions
Target RWE’s proprietary causalStudio™ platform addresses real-world challenges by providing a software solution that leverages validated analytics proven and trusted for regulatory decision-making. causalStudio™ is equipped with advanced epidemiological algorithms and innovative statistical methods that produce both accurate and reliable insights. Our platform provides the tools to address bias often found in real-world analyses by accounting for confounding variables.
With the ability to deploy on any system and with any type of data, our causalStudio™ platform includes two offerings that enhance your data-driven decision-making: causalRisk™ and causalPHR™.
causalRisk™
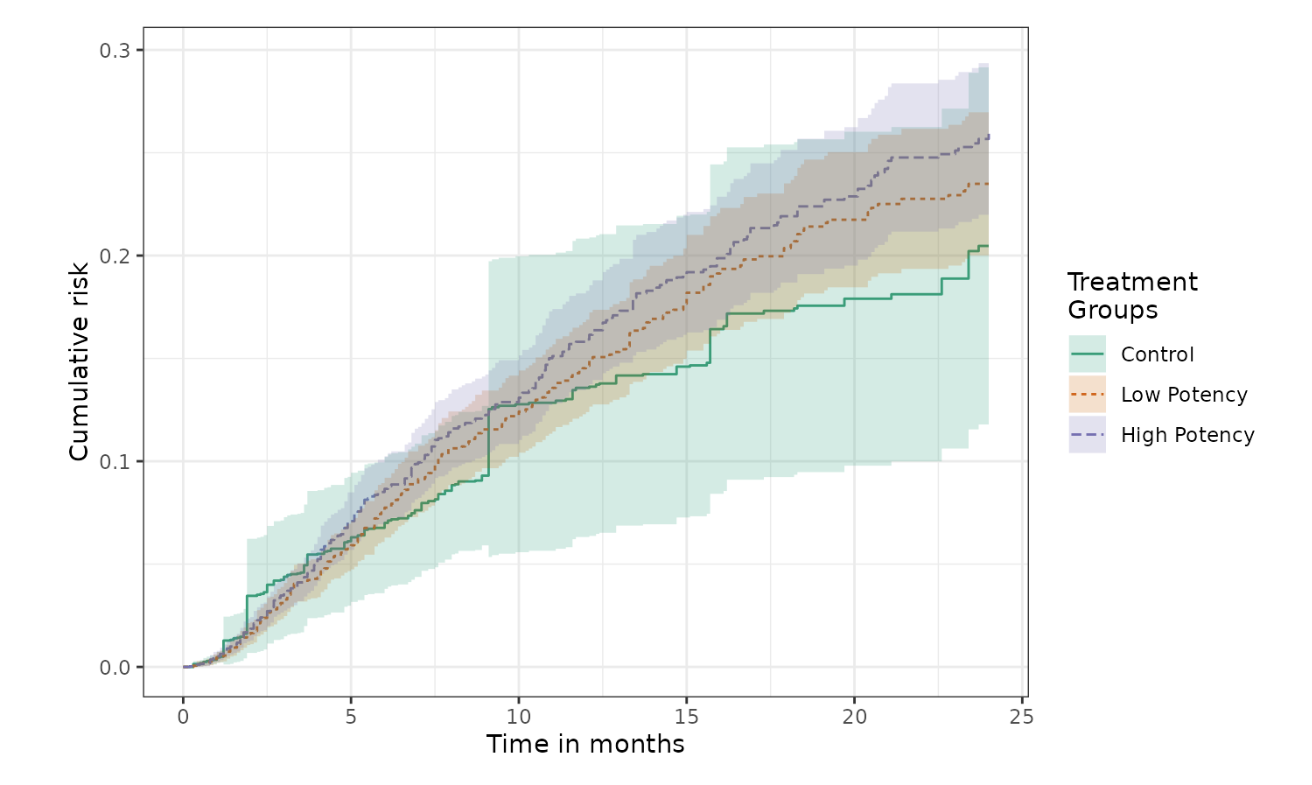
Validated and utilized to support regulatory decision-making, causalRisk™ simplifies the complex process of estimating the cumulative risk of outcomes, even in the presence of dependent censoring, missing data, confounding, selection bias, and competing risks.
-
Convenient R-based analytical packages designed for researchers and data analysts
-
Proprietary R packages that address complications in real-world data and can handle informative censoring, time-varying treatments, or time-varying covariates
-
Ability to conduct principled safety and effectiveness research using robust causal inference methods
Additional causalRisk™ Capabilities Include
-
Range of helper functions to produce common plots and tables
-
Assessing the balance of confounders in an IPTW analysis
-
Handling multiple censoring variables
-
Estimating risk with more than two treatment groups
-
Summarizing weights
-
Propensity score distribution and trimming and truncation
-
Overlap, normalized, and stabilized weights
-
Bootstrap estimation
-
Estimation of cumulative count
-
Example data, vignettes, simulation functions, and testing/simulation scripts in a detailed user manual
causalPHR™
Our causalPHR™ data visualization tool seamlessly connects with causalRisk™ to make visualizing, stratifying, and filtering analytical results straightforward and intuitive.
-
Integrates scientific content relevant across product lifecycle phases into an interactive report, with powerful filtering and stratification capabilities to visualize real-world data
-
Ability to easily view trends in forecasting and treatment pattern analyses to high-risk patient subgroup identification and policy monitoring
-
Drag-and-drop visualizations tailored for the life sciences industry, including cumulative risk plots, forest plots, maps, line charts, Sankey, and Sunburst diagrams, and more
-
Full peer review collaborative workflow, with a table of contents, commenting, and extensive methods section to build your research story
Real-World Case Studies with causalStudio™
Negative Control Outcome Studies to Measure Confounding
Using Negative Control Outcomes to Assess the Comparability of Treatment Groups
Methodology Guidance
Using Instrumental Variables to Address Bias From Unobserved Confounders
Trial Emulation to Support Label Expansion
Why causalStudio™?
causalStudio™ helps researchers navigate the complexities of real-world data to unlock cause-and-effect relationships that drive impactful decisions. Confidently run complex analyses and uncover causal relationships that drive informed decision-making that achieves precise and reliable outcomes.
Leading Technology: Apply data analyses and unlock rich insights with our leading analytical software platform developed by epidemiologists and statisticians for researchers
Regulatory Validation: Trust in analytical software that has been used and validated for regulatory decision-making
Comprehensive Solutions: Use tools that address the challenges of real-world data and identify meaningful insights
Flexible Deployment & Data Agnostic: Easily integrate our software platform on any system and utilize with any data source
Continuous Updates: Keep all study insights in one convenient location, with versioning and iterative updating functionality
Ready to Schedule a Demo?
By Submitting this form, you consent to your information used by Target RWE for the purpose of contacting you to better understand your potential interest in Target RWE and/or its services. For more information, see our privacy policy.